AI Rater Discrimination Depends on Scoring Protocol in Complex Clinical Decision-Making

This paper examines how AI systems, specifically large language models, evaluate clinical decisions in diabetes treatment. It highlights the differences in scoring based on the evaluation method used.

Analyze with PDFdigest
Watch on YouTube
Use the local video fallback

Content & Liability Disclaimer

This article and its accompanying video are automated summaries derived from AI Rater Discrimination Depends on Scoring Protocol in Complex Clinical Decision-Making by Sangwon Baek, Yeon Kyu, Hur, Kyunga Kim. The original research was conducted solely by the paper's authors; PDFdigest did not conduct any of the research and makes no claims of ownership over the underlying scientific work.

The video narration is generated by artificial intelligence and references the paper's authors for attribution. The video is not narrated by any of the paper's authors. This content may contain inaccuracies, omissions, or misinterpretations of the original research. First-person language (e.g., "we found", "our results") reflects the original authors' voice, not PDFdigest's. Always read the original paper for accurate, verified information before making any decisions based on this content.

This content is provided "as is" without any warranties, express or implied. Simulated systems OÜ, its officers, directors, employees, and agents shall not be liable for any direct, indirect, incidental, special, consequential, or punitive damages arising from your use of, reliance on, or access to this content, including but not limited to errors, omissions, or misinterpretations of the original research. This disclaimer applies to the fullest extent permitted by applicable law.

Key Takeaways
  1. 1 These findings indicate that a rater model cannot be assumed to score its own outputs neutrally.
  2. 2 The DRG prompt is designed to produce higher-quality outputs than the Baseline prompt, so the AI rater's ability to distinguish quality differences can be tested against a known contrast.
  3. 3 First, this study reports quantitative comparisons of AI rater scores across scoring protocols but does not examine the internal reasoning processes underlying the observed patterns; understanding rater-side mechanisms is left to future work.
  4. 4 Each model is publicly released under the following license; the Hugging Face Hub identifiers below refer to the NVFP4 quantized variants distributed by NVIDIA and used in deployment (see §D.2 on inference precision).

Introduction

Clinical AI evaluation has begun to incorporate large language models (LLMs) as AI raters that assign scores to clinical outputs produced by other AI systems at scale. This shift reflects two limits of human-based evaluation that have persisted across clinical domains.

Human expert raters disagree with one another on the same case, producing interobserver variability documented in systematic reviews .

Large-scale clinical benchmarks such as MedHELM and HealthBench have already adopted LLM juries as scoring mechanisms, signaling that AI rater-based evaluation is increasingly shaping how clinical AI systems are assessed.

Methodology

To perform this characterization in clinical AI evaluation, we conducted a factorial study of how AI raters behave across a range of evaluation conditions in type 2 diabetes (T2D) pharmacotherapy, a clinical task that involves complex decision-making over multiple drug classes. The evaluation task scores AI-generated treatment recommendations for adult patients with T2D at 12-month outpatient follow-up .

Study Design

Per-level contrasts are summarized across the seven questions by inverse-variance weighting, and per-question p-values are combined by Fisher’s method .

Second, the experimental task is restricted to adult T2D pharmacotherapy at 12-month outpatient follow-up; how the protocol effect translates to clinical tasks with different decision structures remains an open question.

Results & Findings

Expert review also struggles to keep pace with the volume of AI-generated clinical outputs, and the fatigue that accompanies extended review correlates with measurable increases in clinical error . Meeting this responsibility requires more than demonstrating that AI raters produce reasonablelooking scores.

  • Expert review also struggles to keep pace with the volume of AI-generated clinical outputs, and the fatigue that accompanies extended review correlates with measurable increases in.
  • Meeting this responsibility requires more than demonstrating that AI raters produce reasonablelooking scores.
  • With this protocol contrast as the primary axis, we systematically vary clinical decision support system (CDSS) model, CDSS prompt configuration, rater model, prompt character, and prompt.
  • • We characterize how AI rater scoring behavior differs between the GR and Non-GR protocols across the seven evaluation questions (Q1-Q7), quantifying the difference in score.
  • • We quantify whether the two protocols produce different score gaps between higher-quality and lower-quality CDSS outputs, characterizing how the choice of protocol affects the AI.
Important Note

These findings indicate that a rater model cannot be assumed to score its own outputs neutrally.

Important Note

First, this study reports quantitative comparisons of AI rater scores across scoring protocols but does not examine the internal reasoning processes underlying the observed patterns; understanding rater-side mechanisms is left to future work.

How PDFdigest Helps You Understand Research

Instant Paper Analysis

Get structured summaries and key findings from dense PDFs in seconds.

Visual Explanations

Turn complex methods, figures, and results into clearer visual breakdowns.

AI-Powered Q&A

Ask focused questions and get answers grounded in the paper.

Try PDFdigest Free

Practical Applications

AI rater adoption may bring substantial value by enabling systematic, large-scale evaluation, but this benefit must come with a corresponding responsibility: AI raters should function as reliable evaluators if they are to be used for assessing clinical tools. The extraction prompts and intermediate outputs are not released; the reference documents are described structurally in §E.4 and may be requested from the corresponding author.

The expanded GR-side variability in the patient and run components may reflect the rubric exposing patient-specific decision elements that the rater evaluates separately for each patient and at each run, but it may equivalently reflect the narrower Non-GR score band described in §4.1: when AI raters concentrate Non-GR scores within the 70-80 range regardless of.

Related Work

This section reviews existing literature on LLMs as evaluators, focusing on their validation, biases, and the implications of using AI raters in clinical settings.

LLM-as-a-judge in clinical evaluation

The section explores the application of LLMs in clinical evaluations, noting the differences in scoring patterns between AI raters and human evaluators, and identifying gaps in current research.

Limitations and Cautions

A useful limitation and caution is that this article summarizes the available paper text and extracted evidence; readers should consult the source paper before treating any interpretation as definitive.

The paper’s conclusions may depend on its source selection, definitions, assumptions, and the scope of its analysis, so follow-up reading is important.

Source Paper Figures and Captions
Source-paper figure
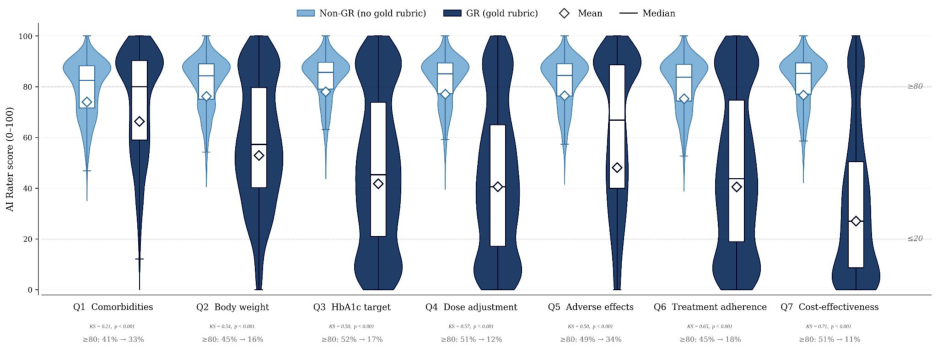
Figure 1: Score distribution under Non-GR and GR protocols by evaluation question. Paired violin plot per question (Q1-Q7)-Non-GR (left, light blue) vs. GR (right, dark navy). White diamonds mark estimated mean scores, box overlays mark median and IQR, and dotted reference lines at 20 and 80 demarcate the floor and ceiling bands. Per-question Kolmogorov-Smirnov statistic, p-value, and change in ceiling-band (≥ 80) fraction are annotated below each question. GR scores are systematically lower and substantially more dispersed than Non-GR scores across all questions, with the protocol-induced shift varying approximately sevenfold (smallest at Q1, largest at Q7). Per-question numerical summaries: Appendix H.1, Table2.
Source-paper figure
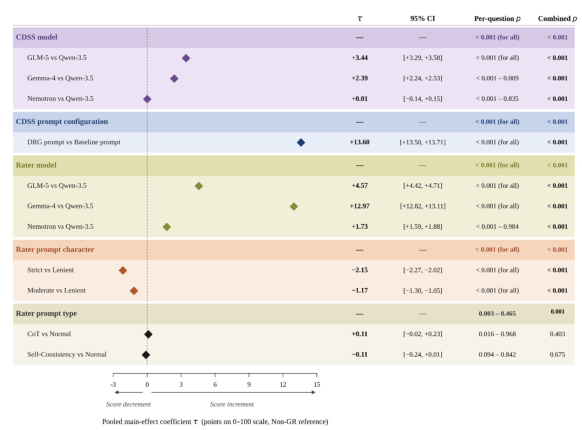
Figure 2: Pooled main-effect estimates for the five non-protocol fixed-effect factors. Forest plot of τ coefficients showing each non-reference level relative to its reference (Baseline, Qwen-3.5, Lenient, Normal): diamonds mark point estimates; horizontal bars mark 95% Wald CIs; the vertical dashed line marks τ = 0. Bold rows at the top of each factor band report the factor-level Type 3 Wald joint test. CDSS prompt configuration (DRG vs. Baseline) and rater-model identity (Gemma-4 vs. Qwen-3.5) carry dominant main effects of comparable magnitude (∼ 13 score points), while prompt-type effects are roughly two orders of magnitude smaller. Question-level estimates and Dunnett-adjusted p-values: Appendix H.2, Table3.
Source-paper figure
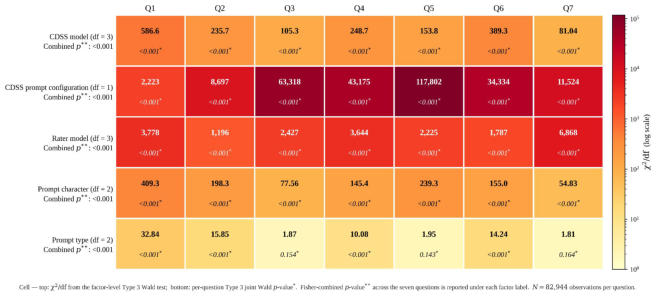
Figure 3: Protocol × factor interaction heatmap across the seven evaluation questions. Each cell shows the per-question Type 3 Wald χ 2 /df statistic (top) and the per-question Type 3 joint Wald p-value (bottom); cell color encodes χ 2 /df on a log scale. Row labels include each factor's degrees of freedom and its Fisher-combined p-value across Q1-Q7. The scoring protocol moderates every non-protocol factor's effect; the protocol × CDSS prompt configuration interaction is the dominant interaction in every question, exceeding the others by an order of magnitude. n = 82,944 observations per question.
Source-paper figure
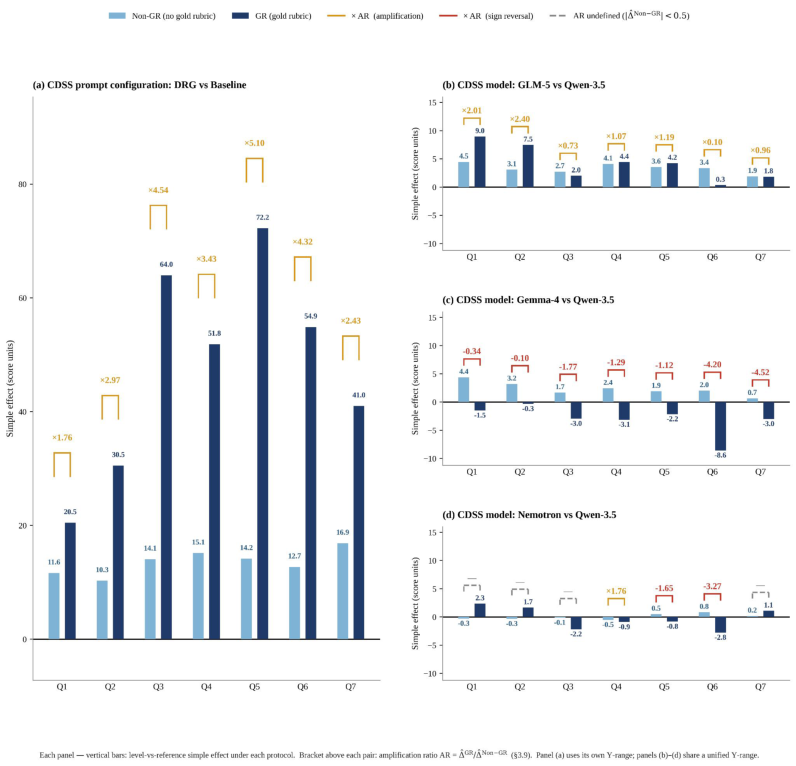
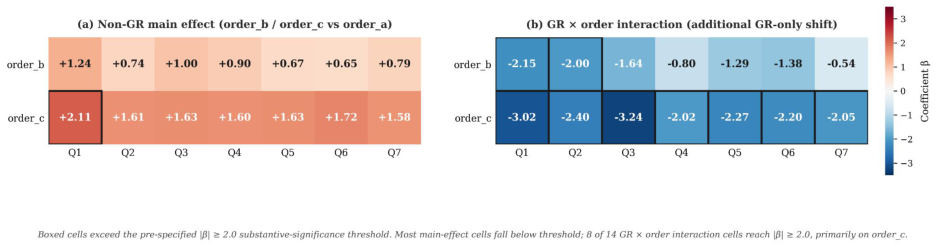
Figure 4: Per-level decomposition of CDSS-side protocol × factor interactions. Four panels: (a) CDSS prompt configuration (DRG vs. Baseline); (b)-(d) CDSS model (GLM-5, Gemma-4, Nemotron each vs. Qwen-3.5). Each panel shows per-question simple effects (level vs. reference) under Non-GR (navy) and GR (maroon). The bracket above each bar pair reports the per-question amplification ratio (AR; Appendix G.5), color-coded amber for amplification, red for sign reversal, and gray dashed when AR is undefined. Panel (a) uses its own Y-range; panels (b)-(d) share a unified Y-range. GR uniformly widens the DRG-Baseline gap across all questions (AR ×1.76 to ×5.10), but reshapes CDSS-model contrasts non-uniformly-including consistent sign reversal for Gemma-4 vs. Qwen-3.5 across every question. Per-level values: Appendix H.4.
Source-paper figure
Pooled main-effect estimates for the five non-protocol fixed-effect factors. For each non-reference level relative to its reference, we report the pooled main effect (τ ) with 95% Wald CI, the Fisher's combined p-value, and the range of per-question Dunnett-adjusted p-values. Reference levels: Baseline (CDSS prompt configuration), Qwen-3.5 (rater model and CDSS model), Lenient (prompt character), Normal (prompt type). n = 82,944 observations per question.
Source-paper figure
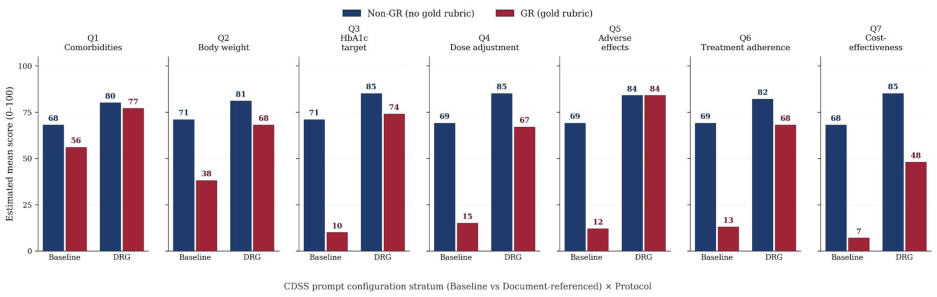
Figure 5: Estimated mean score by evaluation question, CDSS prompt configuration stratum, and scoring protocol. Per-question bars from the stratified LMM (Appendix G.5)-four bars per question: Baseline×Non-GR, Baseline×GR, DRG×Non-GR, DRG×GR. Under Non-GR the DRG-Baseline gap is narrow and roughly constant across questions; under GR the gap widens substantially in every question except Q5, where DRG cells were already near the upper end of the 0-100 scale.
Source-paper figure
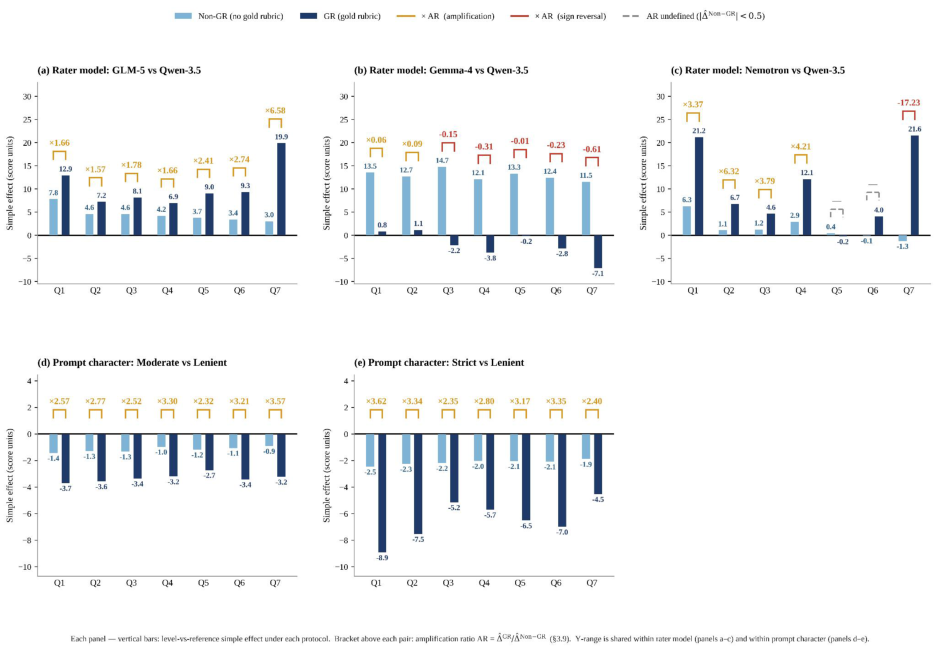
Figure 6: Per-level decomposition of rater-side protocol × factor interactions. Five panels in two rows: top-(a)-(c) rater model (GLM-5, Gemma-4, Nemotron each vs. Qwen-3.5); bottom-(d)-(e) prompt character (Moderate, Strict each vs. Lenient). Each panel shows per-question simple effects (level vs. reference) underNon-GR (navy) and GR (maroon). The bracket above each bar pair reports the per-question amplification ratio (AR; Appendix G.5), color-coded amber for amplification, red for sign reversal, and gray dashed when AR is in the unstable regime defined in Appendix G.5. Y-range is shared within rater model (a-c) and within prompt character (d-e). GR uniformly amplifies prompt-character contrasts across every rater and question, but reshapes rater-model contrasts unevenly-including sign reversal for Gemma-4 vs. Qwen-3.5 across Q3-Q7. The protocol × prompt type interaction is omitted because every cell falls in the unstable regime; see Figure3and Figure7.
Source-paper figure
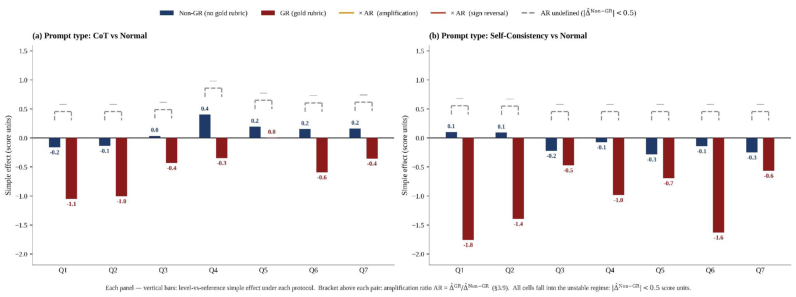
Figure 7: Per-level decomposition of the protocol × prompt type interaction. Two panels: (a) CoT vs. Normal; (b) Self-Consistency vs. Normal. Each panel shows per-question simple effects (level vs. reference)under Non-GR (navy) and GR (maroon); the bracket above each bar pair reports the per-question amplification ratio (AR; Appendix G.5), all of which fall in the unstable regime (gray dashed). The protocol × prompt type interaction is the smallest in the design-every per-question contrast falls in the AR-undefined regime under both protocols, indicating that structured deliberation does not supply patient-specific scoring criteria the way a rubric does.
Source-paper figure
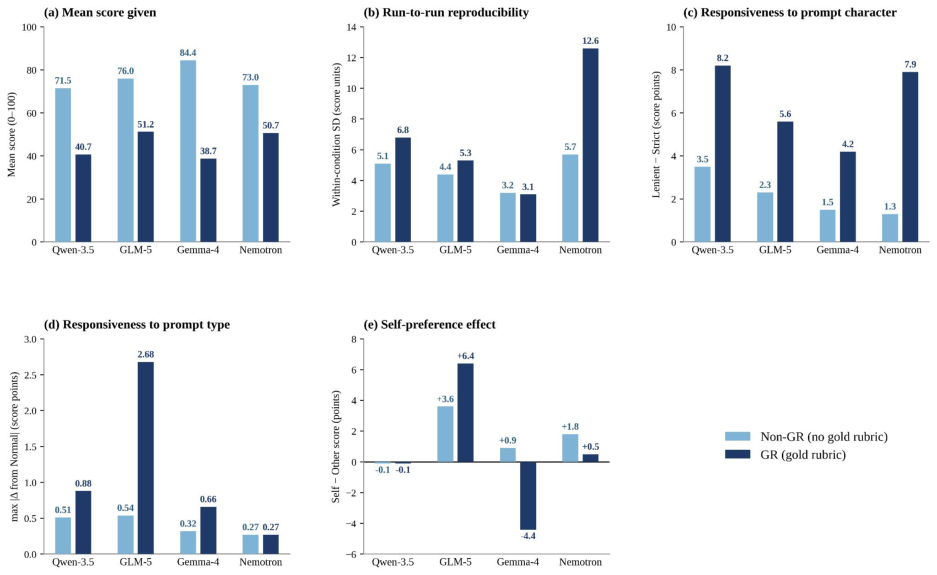
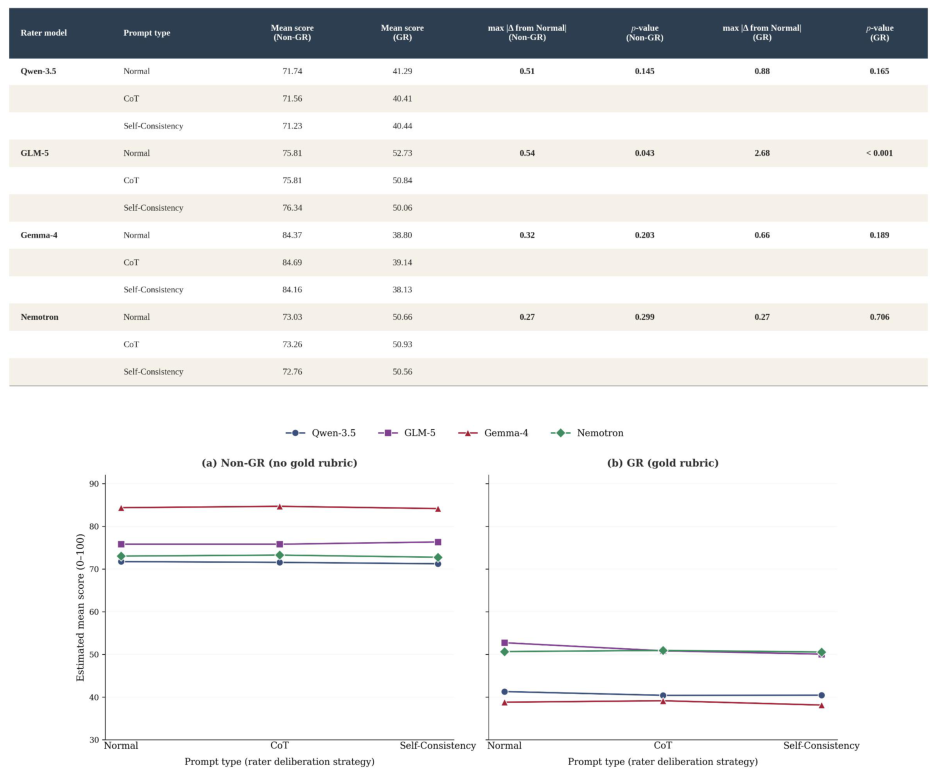
Figure 8: Per-rater behavioral profile under each scoring protocol. Five panels (a-e) compare the four LLMs in their AI rater role (Qwen-3.5, GLM-5, Gemma-4, Nemotron) along five behavioral dimensions: (a) mean score, (b) run-to-run reproducibility, (c) responsiveness to prompt character, (d) responsiveness to prompt type, (e) self-preference effect. Each rater is shown with two bars per dimension-Non-GR in light blue, GR in dark navy. All five behavioral dimensions are rater-specific and protocol-conditional; per-rater protocol-induced shifts substantially varied (22.30-45.72 points), large enough to invalidate cross-protocol rater rankings. Operational definitions: Appendix A; full numerical records: §I.1- §I.6.
Source-paper figure
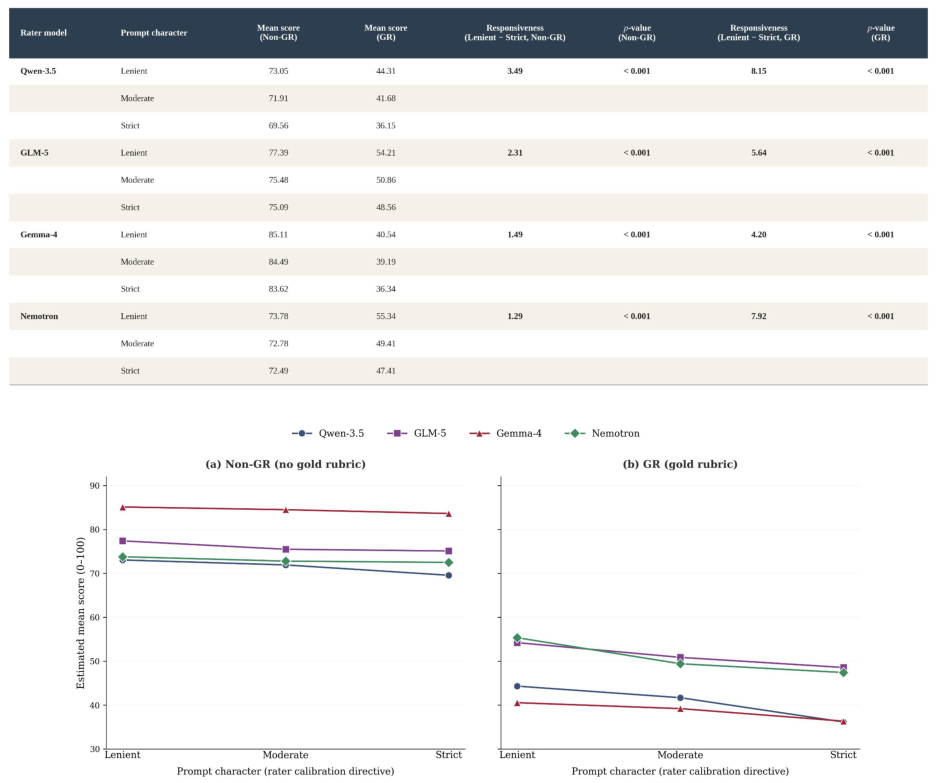
Per-rater mean score by prompt character × scoring protocol. Mean score at each prompt character level (Lenient, Moderate, Strict) by rater × protocol, the responsiveness to prompt character (Lenient -Strict gap; Appendix G.5), and the p-value for the per-rater Lenient -Strict gap from the protocol × prompt character interaction.
Source-paper figure
Figure 9: Per-rater mean score across prompt character levels under each scoring protocol. Line plot of mean score by AI rater (Qwen-3.5, GLM-5, Gemma-4, Nemotron) across the three prompt character levels (Lenient, Moderate, Strict) under (a) Non-GR and (b) GR. The Lenient-Strict score gap amplifies under GR for every rater (Non-GR 1.3-3.5 points to GR 4.2-8.2 points), indicating that prompt-level calibration directives complement rather than substitute for rubric anchoring.
Source-paper figure
Per-rater mean score by prompt type × scoring protocol. Mean score at each prompt type level (Normal, CoT, SC) by rater × protocol, the responsiveness to prompt type (max |∆ from Normal|; Appendix G.5), and the p-value for the per-rater max |∆| from the protocol × prompt type interaction.
PDFDIGEST AI

Struggling to understand complex research papers?

Upload any PDF and get instant AI-powered explanations, summaries, and visual breakdowns. Turn dense academic writing into clear, actionable insights.

Upload a Paper

Frequently Asked Questions

Clinical AI evaluation has begun to incorporate large language models (LLMs) as AI raters that assign scores to clinical outputs produced by other AI systems at scale. Zhu et al. applied variance decomposition to general-domain evaluation and reported that systematic judge bias.

Second, the experimental task is restricted to adult T2D pharmacotherapy at 12-month outpatient follow-up; how the protocol effect translates to clinical tasks with different decision structures remains an open question. The role-and-scope and quality-assurance blocks are held in stable positions across all.

These findings indicate that a rater model cannot be assumed to score its own outputs neutrally. The DRG prompt is designed to produce higher-quality outputs than the Baseline prompt, so the AI rater’s ability to distinguish quality differences can be tested against.

AI rater adoption may bring substantial value by enabling systematic, large-scale evaluation, but this benefit must come with a corresponding responsibility: AI raters should function as reliable evaluators if they are to be used for assessing clinical tools. GR scoring is therefore.

These findings indicate that a rater model cannot be assumed to score its own outputs neutrally. First, this study reports quantitative comparisons of AI rater scores across scoring protocols but does not examine the internal reasoning processes underlying the observed patterns; understanding.

This paper examines how AI systems, specifically large language models, evaluate clinical decisions in diabetes treatment. It highlights the differences in scoring based on the evaluation method used.