deepFEPS: Deep Learning-Oriented: Evidence from Extraction Biological
deepFEPS is a user-friendly tool that helps researchers convert biological sequences into numerical data for machine learning. It simplifies the process by combining various methods into one platform.
Content & Liability Disclaimer
This article and its accompanying video are automated summaries derived from deepFEPS: Deep Learning-Oriented Feature Extraction for Biological Sequences by Hamid Ismail, Marwan Bikdash. The original research was conducted solely by the paper's authors; PDFdigest did not conduct any of the research and makes no claims of ownership over the underlying scientific work.
The video narration is generated by artificial intelligence and references the paper's authors for attribution. The video is not narrated by any of the paper's authors. This content may contain inaccuracies, omissions, or misinterpretations of the original research. First-person language (e.g., "we found", "our results") reflects the original authors' voice, not PDFdigest's. Always read the original paper for accurate, verified information before making any decisions based on this content.
This content is provided "as is" without any warranties, express or implied. Simulated systems OÜ, its officers, directors, employees, and agents shall not be liable for any direct, indirect, incidental, special, consequential, or punitive damages arising from your use of, reliance on, or access to this content, including but not limited to errors, omissions, or misinterpretations of the original research. This disclaimer applies to the fullest extent permitted by applicable law.
- 1 Neural networks entered the field in 1988, when they were first applied to predict the secondary structure of globular proteins .
- 2 Algorithms such as Support Vector Machines (SVMs), Random Forests (RF), and kernel methods were increasingly applied to a wide range of problems, including promoter prediction, splice site recognition, noncoding RNA classification, and protein-protein interaction prediction .
- 3 One of the first breakthroughs was DeepBind, which employed convolutional neural networks (CNNs) to predict protein-DNA and protein-RNA binding, showing that deep architectures could surpass classical motif-based approaches .
- 4 Extending beyond word embeddings, Doc2Vec has been utilized to obtain sequence-level representations, allowing entire genes or proteins to be embedded into a continuous space for downstream classification tasks .
Introduction
Extracting numerical features from biological sequences has long been a challenge, largely because these sequences are inherently textual and must be transformed into meaningful numerical representations before they can be used in machine learning. This process often requires considerable programming and computational expertise.
By the 1990s, hidden Markov models (HMMs) had gained popularity for tasks such as gene prediction, protein family classification, and motif discovery .
These traditional machine learning methods typically relied on features derived from classical sequence descriptors, such as nucleotide or amino acid composition, physicochemical properties, and autocorrelation descriptors .
Methodology
The application of machine learning to biological sequences dates back to 1962, when Margaret Oakley Dayhoff and Richard Eck reconstructed evolutionary relationships using a maximum parsimony method, an approach that can be regarded as an early form of computational inference from molecular data . The scope of machine learning in biological sequence analysis expanded dramatically after the completion of the Human Genome Project in 2003 and the subsequent explosion of.
Study Design
Building on the foundations of traditional machine learning and feature extraction, the advent of deep learning marked a transformative era in biological sequence analysis beginning around 2015.
By moving beyond simple k-mer counts and handcrafted descriptors, deepFEPS captures higher-order dependencies and complex sequence relationships, enabling more powerful and generalizable analysis across a wide range of sequence-based bioinformatics applications.
Results & Findings
Neural networks entered the field in 1988, when they were first applied to predict the secondary structure of globular proteins . Algorithms such as Support Vector Machines (SVMs), Random Forests (RF), and kernel methods were increasingly applied to a wide range of problems, including promoter prediction, splice site recognition, noncoding RNA classification, and protein-protein interaction prediction .
- Neural networks entered the field in 1988, when they were first applied to predict the secondary structure of globular proteins .
- Algorithms such as Support Vector Machines (SVMs), Random Forests (RF), and kernel methods were increasingly applied to a wide range of problems, including promoter prediction, splice.
- One of the first breakthroughs was DeepBind, which employed convolutional neural networks (CNNs) to predict protein-DNA and protein-RNA binding, showing that deep architectures could surpass classical.
- In the same year, DeepSEA extended CNNs to model the chromatin effects of noncoding variants, laying the groundwork for interpreting genome-wide regulatory activity directly from raw.
- A few years later, AlphaFold demonstrated the unprecedented capacity of deep neural networks in structural biology, reaching near-experimental accuracy in protein structure prediction and fundamentally reshaping.
Classical tools such as iFeature and dna2vec provided access to predefined descriptors or word embedding-based representations, but were limited in scope and flexibility.
Neural networks entered the field in 1988, when they were first applied to predict the secondary structure of globular proteins .
How PDFdigest Helps You Understand Research
Instant Paper Analysis
Get structured summaries and key findings from dense PDFs in seconds.
Visual Explanations
Turn complex methods, figures, and results into clearer visual breakdowns.
AI-Powered Q&A
Ask focused questions and get answers grounded in the paper.
Practical Applications
Such handcrafted features provided the foundation for training models that could capture sequence patterns and address a variety of supervised learning problems in bioinformatics.
Background
The extraction of numerical features from biological sequences has been challenging due to their textual nature. Traditional machine learning methods relied on handcrafted features, while deep learning has transformed biological sequence analysis since the completion of the Human Genome Project.
Implementation
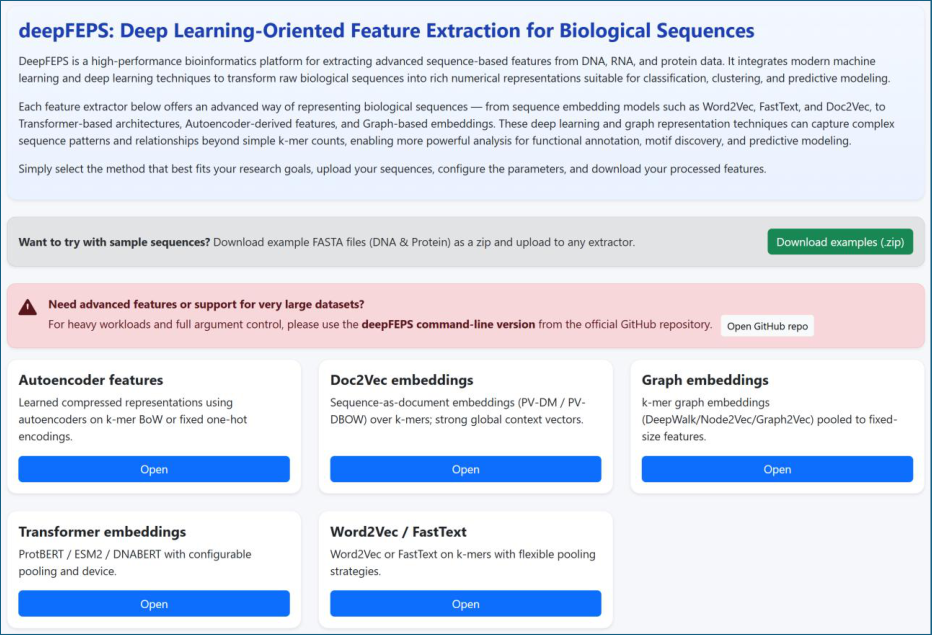
deepFEPS is a modular toolkit that consolidates various sequence representation methods into a reproducible framework. It supports DNA, RNA, and protein FASTA inputs through a web server and command-line interface, allowing users to compare feature extraction strategies.
Feature extractors 1. k-mer Word2Vec/FastText
This method segments biological sequences into overlapping k-mers, which are then embedded using models like Word2Vec or FastText. The resulting embeddings capture local compositional context and serve as robust baselines for downstream tasks.
Source Paper Figures and Captions
Frequently Asked Questions
More recently, advances from natural language processing and representation learning have been extensively adapted to genomics and proteomics. Embedding methods such as Word2Vec and FastText have been applied to biological sequences, treating k-mers as tokens to generate dense distributed representations that capture.
For instance, they have been used to denoise single-cell RNA-seq data, improving downstream clustering and differential expression analysis . ESM models have been applied to protein structure prediction, mutation effect analysis, and function annotation, often rivaling experimental pipelines in speed and accuracy.
Neural networks entered the field in 1988, when they were first applied to predict the secondary structure of globular proteins . Algorithms such as Support Vector Machines (SVMs), Random Forests (RF), and kernel methods were increasingly applied to a wide range of.
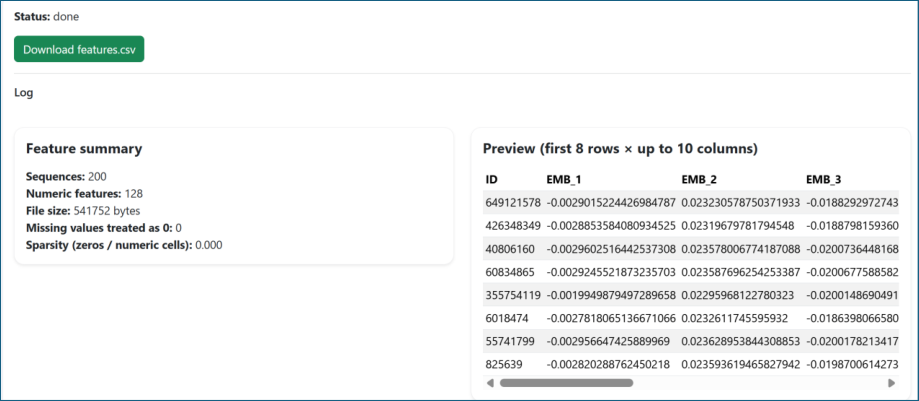
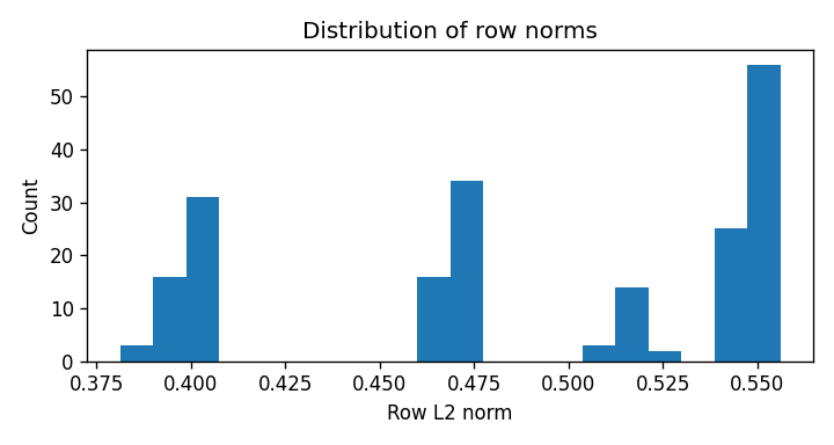
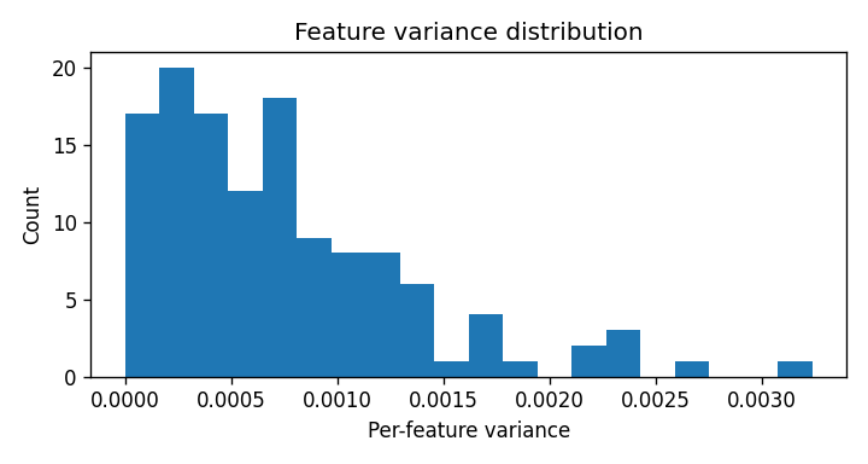
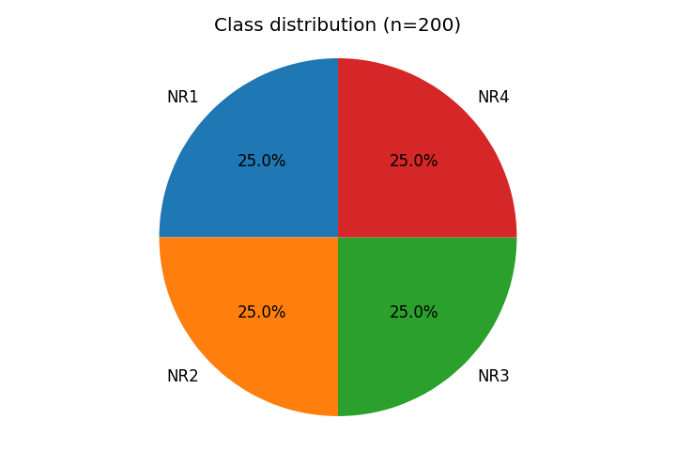
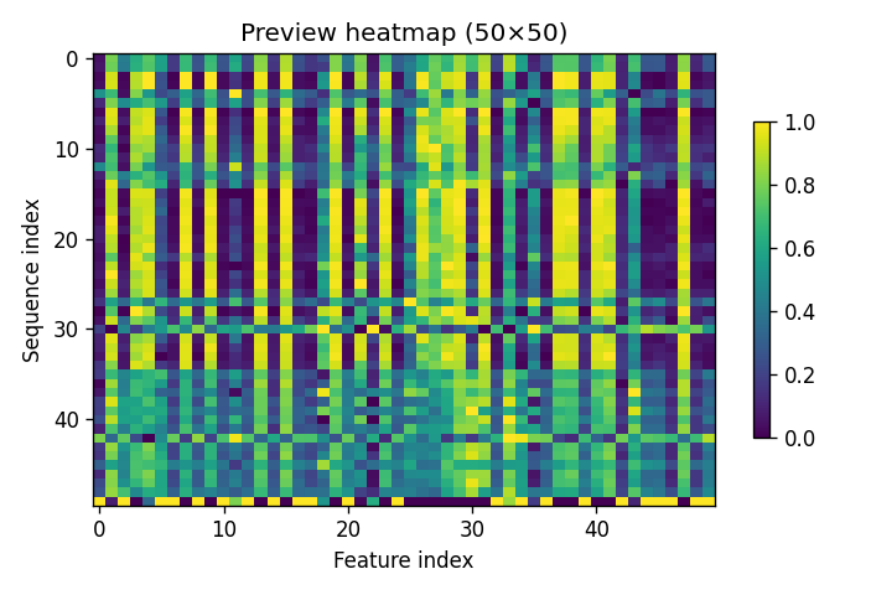
Such handcrafted features provided the foundation for training models that could capture sequence patterns and address a variety of supervised learning problems in bioinformatics. To make the output immediately interpretable, the web interface provides a quality-control dashboard, as shown in Figure 2.
Classical tools such as iFeature and dna2vec provided access to predefined descriptors or word embedding-based representations, but were limited in scope and flexibility.
deepFEPS is a user-friendly tool that helps researchers convert biological sequences into numerical data for machine learning. It simplifies the process by combining various methods into one platform.