Impoola: The Power of Average Pooling: Evidence from Deep Reinforcement

This paper discusses a new approach to improving deep learning models used in teaching computers to play games by changing how they process images. The authors found that a simpler method of summarizing image data leads to better performance than more complex.

Analyze with PDFdigest

Content & Liability Disclaimer

This article and its accompanying video are automated summaries derived from Impoola: The Power of Average Pooling for Image-Based Deep Reinforcement Learning by Raphael Trumpp, Ansgar Schäfftlein, Mirco Theile, Marco Caccamo. The original research was conducted solely by the paper's authors; PDFdigest did not conduct any of the research and makes no claims of ownership over the underlying scientific work.

The video narration is generated by artificial intelligence and references the paper's authors for attribution. The video is not narrated by any of the paper's authors. This content may contain inaccuracies, omissions, or misinterpretations of the original research. First-person language (e.g., "we found", "our results") reflects the original authors' voice, not PDFdigest's. Always read the original paper for accurate, verified information before making any decisions based on this content.

This content is provided "as is" without any warranties, express or implied. Simulated systems OÜ, its officers, directors, employees, and agents shall not be liable for any direct, indirect, incidental, special, consequential, or punitive damages arising from your use of, reliance on, or access to this content, including but not limited to errors, omissions, or misinterpretations of the original research. This disclaimer applies to the fullest extent permitted by applicable law.

Key Takeaways
  1. 1 Another line of work has emphasized the impact of improved network design in particular to scale fully connected networks in regular DRL.
  2. 2 A number of invariance-based methods have been shown to facilitate generalization for Procgen environments, ranging from auxiliary losses to data augmentation .
  3. 3 The generalized advantage estimate (GAE) is the common choice to estimate A(s, a).
  4. 4 This change has a vast influence on the model architecture, as it reduces feature maps to single entries.

Introduction

Recent works on deep reinforcement learning (DRL) have revealed that apart from algorithmic improvements, considerable performance increases can come from the network architecture and training approach of the used deep neural networks (DNNs). There is high interest in finding methods for network scaling in image-based DRL in recent studies .

Most of these works use the aforementioned Impala-CNN as the image encoder, typically scaling the network’s width by increasing the output channels per Conv2d layer by a factor τ .

Similar design improvements for image-based DRL are of high practical appeal, primarily due to the prominence of end-to-end learning in robotic applications .

Important Note

This approach cannot be transferred to Procgen as the backgrounds are not unicolor.

Important Note

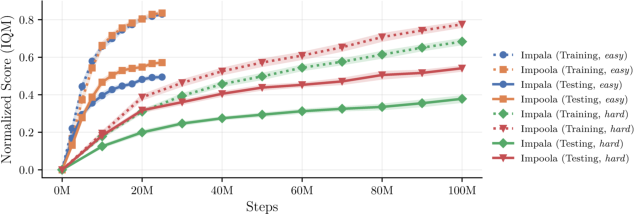
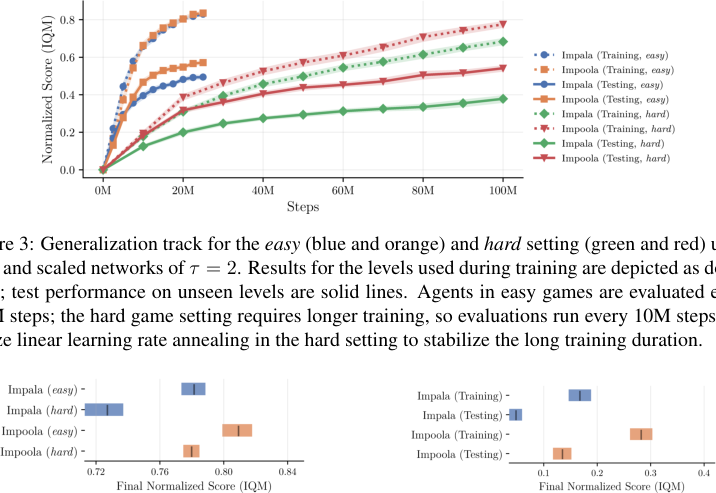
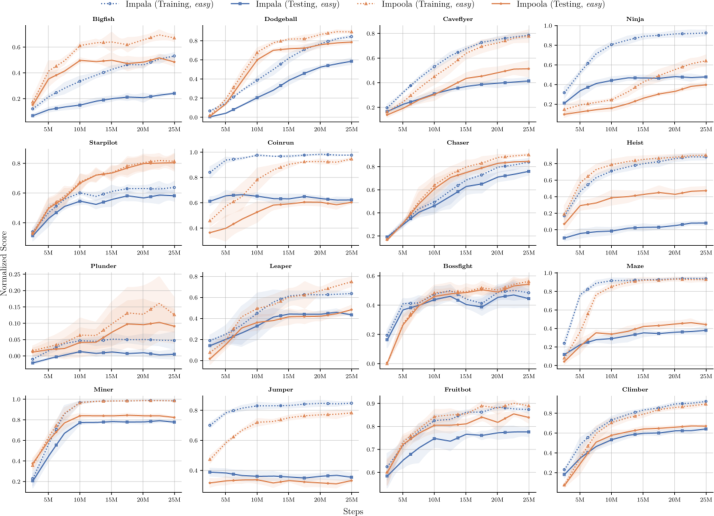
In the easy setting, the performance of Impala-CNN on training levels trails the proposed Impoola-CNN only by a limited margin.

Methodology

• Our analysis investigates the effect of the GAP layer on the network dynamics, identifying its decreased translation sensitivity as a characteristic quality of Impoola-CNN. Further analysis by Sokar et al. identifies the tokenization of the feature maps for SoftMoEs, rather than the use of multiple experts, to drive the performance gain found in Obando-Ceron et al. .

Study Design

Actor-Critic Methods: In addition to a critic network, e.g., V (s; ϕ) that estimates the state value, the action policy is defined as a dedicated actor network that can be directly optimized towards an optimization goal. PPO is an on-policy DRL method, where the weights θ are updated with respect to the advantage function A(s.

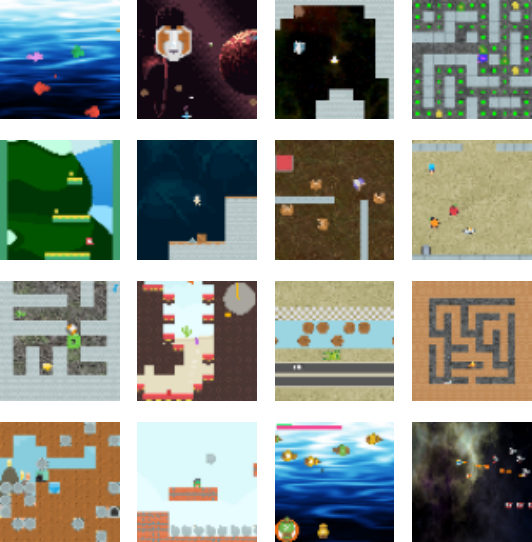
Experiment Design: We base our analysis on the Procgen Benchmark .

Results & Findings

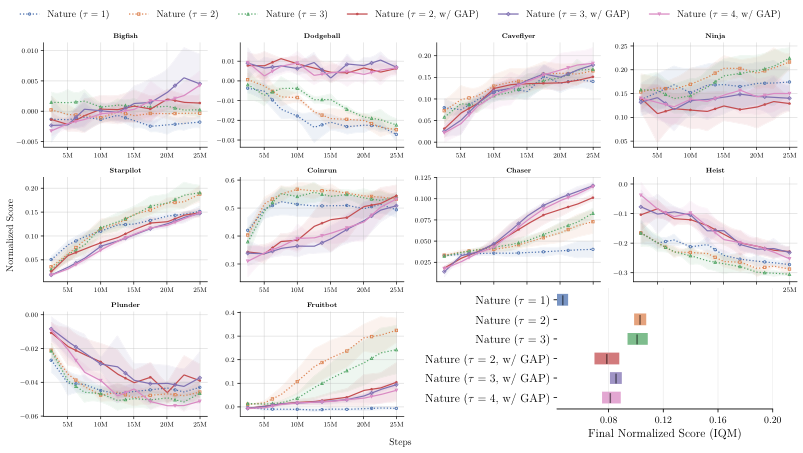
Notably, the Impala-CNN model , a 15-layer convolutional neural network (CNN) with residual connections, outperforms the previously widely used Nature-CNN foot_0 as image encoder for image-based DRL substantially . However, raising the parameter count of DNNs in DRL does not obey scaling laws for better performance as found in other areas in deep learning (DL) , e.g., scaling ResNets to up to 152 layers improves performance for image classification .

  • Notably, the Impala-CNN model , a 15-layer convolutional neural network (CNN) with residual connections, outperforms the previously widely used Nature-CNN foot_0 as image encoder for image-based.
  • However, raising the parameter count of DNNs in DRL does not obey scaling laws for better performance as found in other areas in deep learning (DL).
  • Another line of work has emphasized the impact of improved network design in particular to scale fully connected networks in regular DRL.
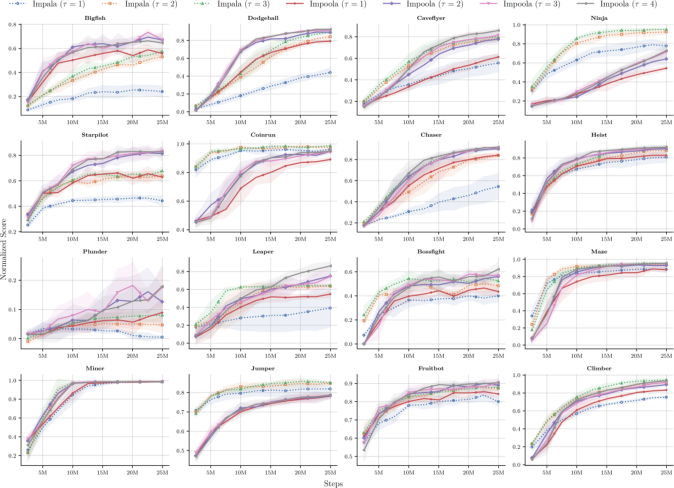
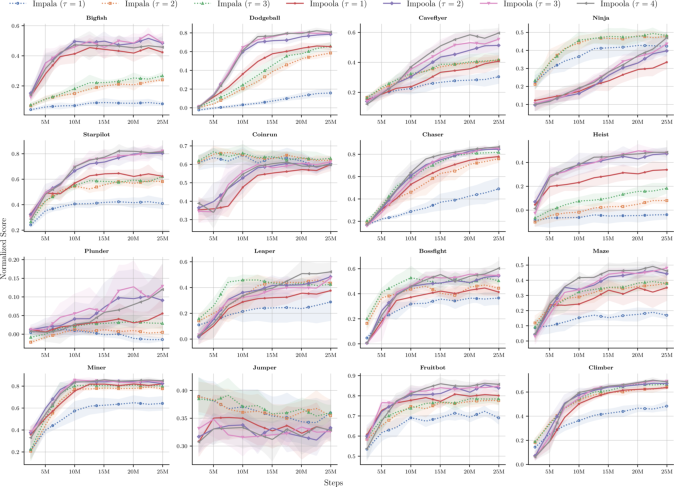
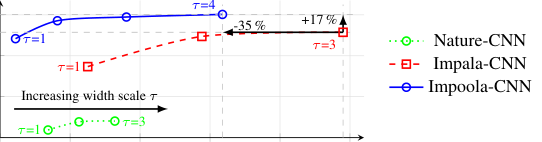
  • Nature-CNN Impala-CNN Impoola-CNN Figure 1 : Impoola-CNN shows higher generalization over the full Procgen Benchmark than the Nature-CNN and Impala-CNN image encoders when scaling the network.
  • The presented results are obtained by evaluating the PPO agent on testing levels after 25M training steps.
Important Note

For future work, we plan to conduct further experiments outside the Procgen Benchmark.

Important Note

Another line of work has emphasized the impact of improved network design in particular to scale fully connected networks in regular DRL.

How PDFdigest Helps You Understand Research

Instant Paper Analysis

Get structured summaries and key findings from dense PDFs in seconds.

Visual Explanations

Turn complex methods, figures, and results into clearer visual breakdowns.

AI-Powered Q&A

Ask focused questions and get answers grounded in the paper.

Try PDFdigest Free

Practical Applications

Overfitting in DRL may be associated with a loss of network plasticity and generalization is theoretically closely related to invariances . We reason that positional information may only be a helpful inductive bias early in training for agent-centered games.

Our advancement is based on the introduction of a GAP layer to the Impala-CNN, which has a two-fold implication.

Related Work

This section reviews recent studies on network scaling in deep reinforcement learning, noting that improvements in network architecture can lead to better performance before scaling parameter counts. It also discusses the significance of the Impala-CNN model in enhancing performance for various games.

Deep Reinforcement Learning

This section outlines the fundamentals of deep reinforcement learning, including the Markov decision process, Q-Network methods, and actor-critic methods, providing a foundation for understanding the algorithms used in the study.

Convolutional Neural Networks

The section describes the architecture of Impala-CNN, detailing its components and the role of pooling layers. It explains how global average pooling can reduce translation sensitivity and simplify network architecture.

Source Paper Figures and Captions
Source-paper figure
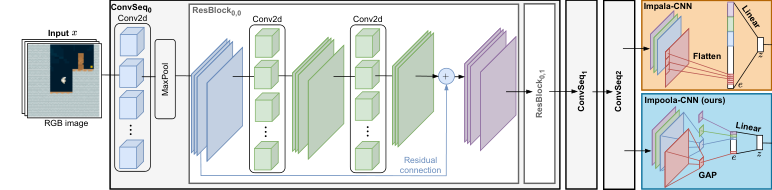
Figure 2: The Impala/Impoola-CNN models encode input images x through a ResNet design, consisting of stacked ConvSeq blocks. ConvSeq blocks are built upon a first Conv2D layer, MaxPooling with stride 2, and two consecutive ResBlocks. ResBlocks are based on two Conv2d layers with a residual connection. The final feature maps are reduced to single values by using a GAP layer in Impoola-CNN, while the Impala-CNN flattens all features directly, resulting in a high-dimensional encoding e. This encoding is then projected to the encoder's output variable z by a Linear layer.
Source-paper figure
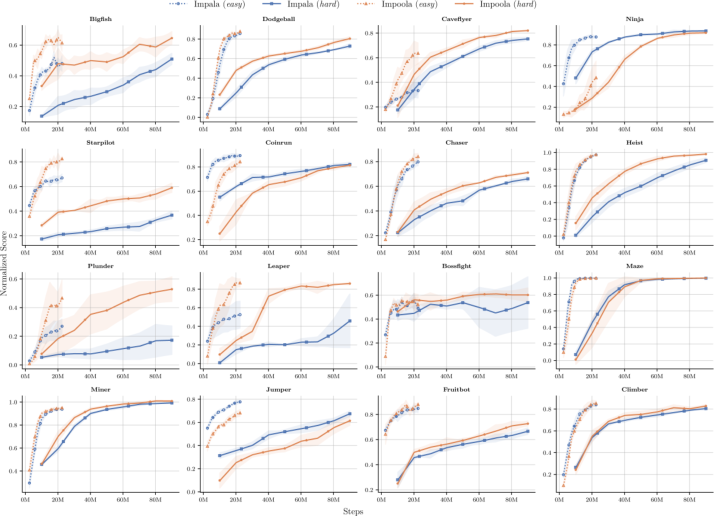
Figure 3: Generalization track for the easy (blue and orange) and hard setting (green and red) using PPO and scaled networks of τ = 2. Results for the levels used during training are depicted as dotted lines; test performance on unseen levels are solid lines. Agents in easy games are evaluated every 2.5M steps; the hard game setting requires longer training, so evaluations run every 10M steps. We utilize linear learning rate annealing in the hard setting to stabilize the long training duration.
Source-paper figure
(a) Efficiency tracks for PPO. (b) Generalization track (easy setting) for DQN.
Source-paper figure
Figure 4: Further evaluation of Impala-CNN and Impoola-CNN encoders (τ = 2). We test PPO additionally for the efficiency track (left) and show results for DQN-based agents (right).
Source-paper figure
(a) Benchmarking with other methods. (b) Probability of improvement that Algorithm X (left) performs better than Algorithm Y (right).
Source-paper figure
Figure 5: Benchmarking the Impoola-CNN (τ = 2) against other methods for the generalization track (easy) across the full Procgen Benchmark. We extend the Impala-CNN (τ = 2) by gradual magnitude pruning (Obando-Ceron et al., 2024a), SoftMoE (Obando-Ceron et al., 2024b), and ReDo (Sokar et al., 2023) for comparison. We present the final IQM scores (left) and the probability of improvement (right). The probability of improvement is a measure to estimate how likely it is that an algorithm outperforms another one in a single environment on average.
Source-paper figure
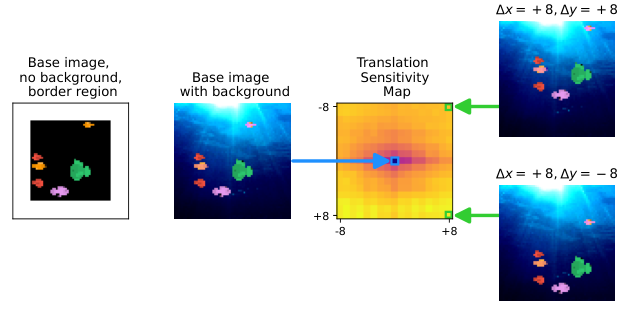
Figure6: Translation sensitivity maps for the actor network of PPO in Bigfish (non-agent-centered game). The maps depict at each pixel (x,y) the corresponding sensitivity score that measures how the action probability distribution deviates when translating the input image by (x,y) pixels compared to the untranslated image. As the x and y axes are centered around 0, the center pixel's sensitivity score is always 0 as it references the untranslated image. Bright yellow colors indicate high translation sensitivity, i.e., the action probabilities differ substantially when translating the input by (x,y).
Source-paper figure
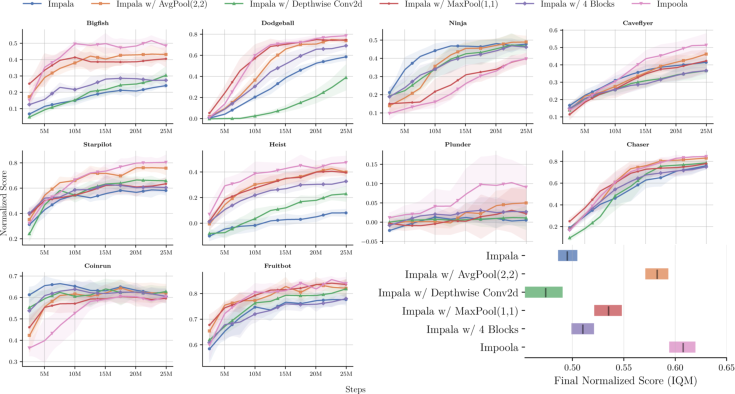
Figure 7: Ablation study of Impoola-CNN (τ = 2) with results for generalization (easy) using a subset of 10 Procgen games. Note that Caveflyer, Coinrun, and Ninja are environments with agentcentered observations. We show the final IQM scores (bottom right) and training curves with mean and standard deviation (rest).
Source-paper figure
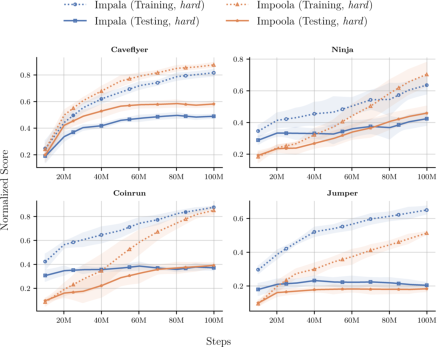
Figure 8: Results for games with agent-centered observations in the generalization track (hard) for PPO (τ = 2).
Source-paper figure
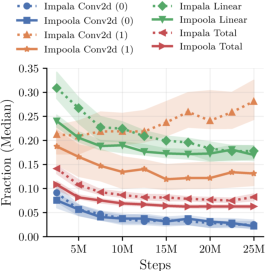
Figure 9: Fraction of dormant neurons per layer throughout training for the first two Conv2d layers of the encoder (τ = 2), its output Linear layer, and for the total network.
Source-paper figure
Figure B.2: Generation of translation sensitivity maps.For the arrangement of fish, we require a free border region (white) with a width of 10 pixels, which ensures that translations by ±8 pixels do not remove any fish from the frame (left). We then add the background to obtain the base image, which provides the base actor output (middle left). Each pixel of the translation sensitivity map (middle right) corresponds to a translation of the entities in the foreground relative to the base image. For example, the pixel in the right upper corner corresponds to the maximal translation to the right and upward (upper right).
Source-paper figure
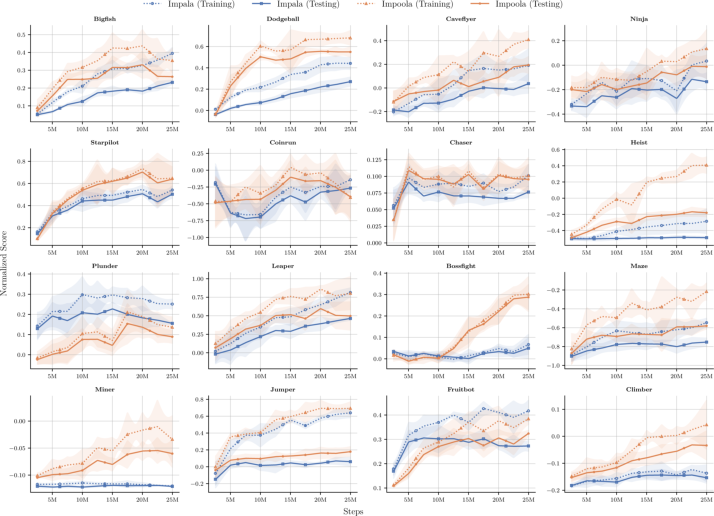
Figure E.6: Detailed results for PPO (τ = 2) in the easy generalization track for training and testing levels. Training levels are depicted as dotted lines.
Source-paper figure
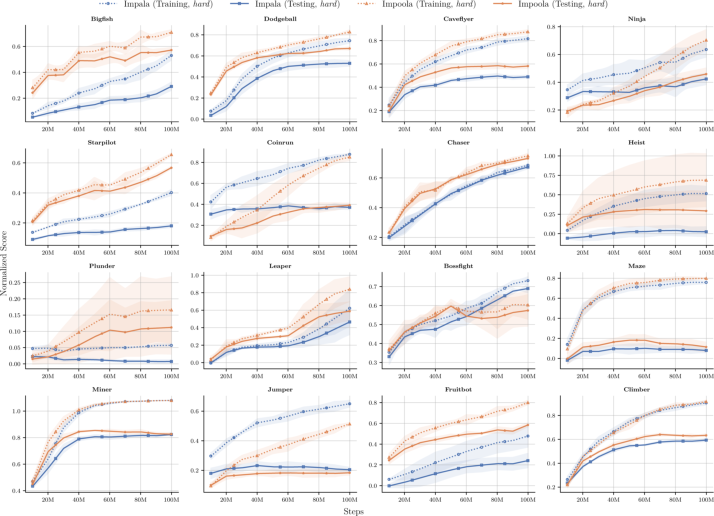
Figure E.7: Detailed results for PPO (τ = 2) in the hard generalization track for training and testing levels. Training levels are depicted as dotted lines.
Source-paper figure
Figure E.8: Detailed results for PPO (τ = 2) in the efficiency track (easy and hard). Easy levels are depicted as dotted lines.
Source-paper figure
Figure E.9: Detailed results for DQN (τ = 2) in the generalization track (easy) for training and testing levels. Training levels are depicted as dotted lines.
Source-paper figure
Figure E.10: Detailed results for the benchmark of Impoola-CNN (τ = 2) against other methods in the generalization track (easy) for testing levels.
Source-paper figure
Figure 17
Figure 17
Source-paper figure
Figure 18
Figure 18
PDFDIGEST AI

Struggling to understand complex research papers?

Upload any PDF and get instant AI-powered explanations, summaries, and visual breakdowns. Turn dense academic writing into clear, actionable insights.

Upload a Paper

Frequently Asked Questions

Similar design improvements for image-based DRL are of high practical appeal, primarily due to the prominence of end-to-end learning in robotic applications . Translation Invariance: A strong inductive bias in computer vision is to incorporate translation invariance, i.e., invariance to the shifts.

Further analysis by Sokar et al. identifies the tokenization of the feature maps for SoftMoEs, rather than the use of multiple experts, to drive the performance gain found in Obando-Ceron et al. . It is evident that the gradual magnitude pruning method.

Another line of work has emphasized the impact of improved network design in particular to scale fully connected networks in regular DRL. A number of invariance-based methods have been shown to facilitate generalization for Procgen environments, ranging from auxiliary losses to data.

Notably, this layer also has a very high fraction of the network’s overall weights placed due to the high-dimensional embedding created by the Flatten layer. Overfitting in DRL may be associated with a loss of network plasticity and generalization is theoretically closely.

For future work, we plan to conduct further experiments outside the Procgen Benchmark. This approach cannot be transferred to Procgen as the backgrounds are not unicolor.

This paper discusses a new approach to improving deep learning models used in teaching computers to play games by changing how they process images. The authors found that a simpler method of summarizing image data leads to better performance than more complex.

Related Research

Research

A Survey on Human-Centered Evaluation of Explainable AI Methods in Clinical Decision Support Systems

This paper reviews how explainable AI methods are evaluated in clinical decision support systems, emphasizing the importance of making AI understandable for…

10 min read